How to Utilize a Thermal Comfort Measuring System for Optimal Indoor Environments
In recent years, the importance of creating optimal indoor environments has gained significant traction, particularly in sectors such as
commercial buildings,
healthcare facilities, and
educational institutions.
Research indicates that a comfortable indoor climate can enhance occupant productivity by up to
15% and reduce absenteeism significantly (World Green Building Council, 2020).
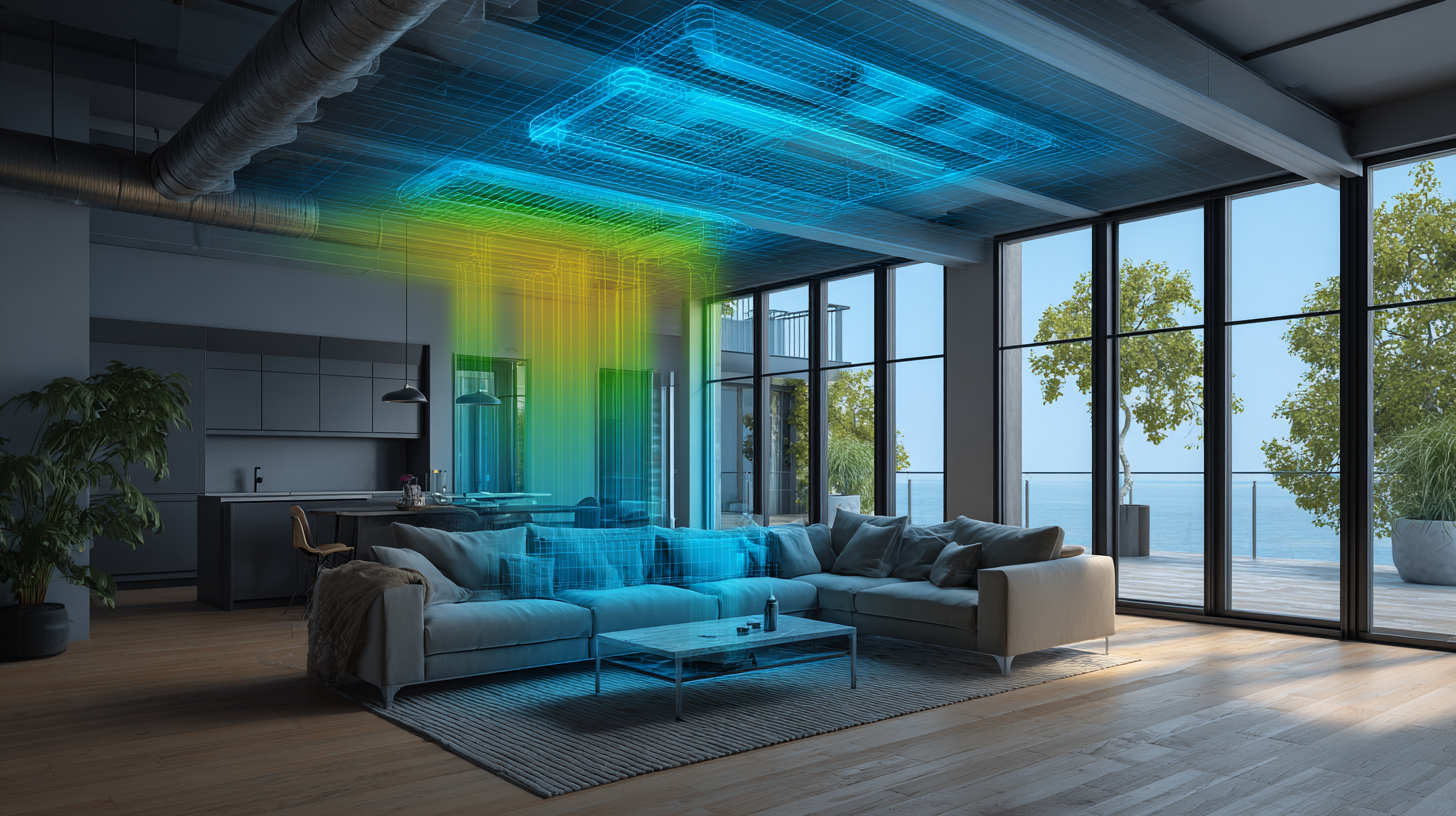
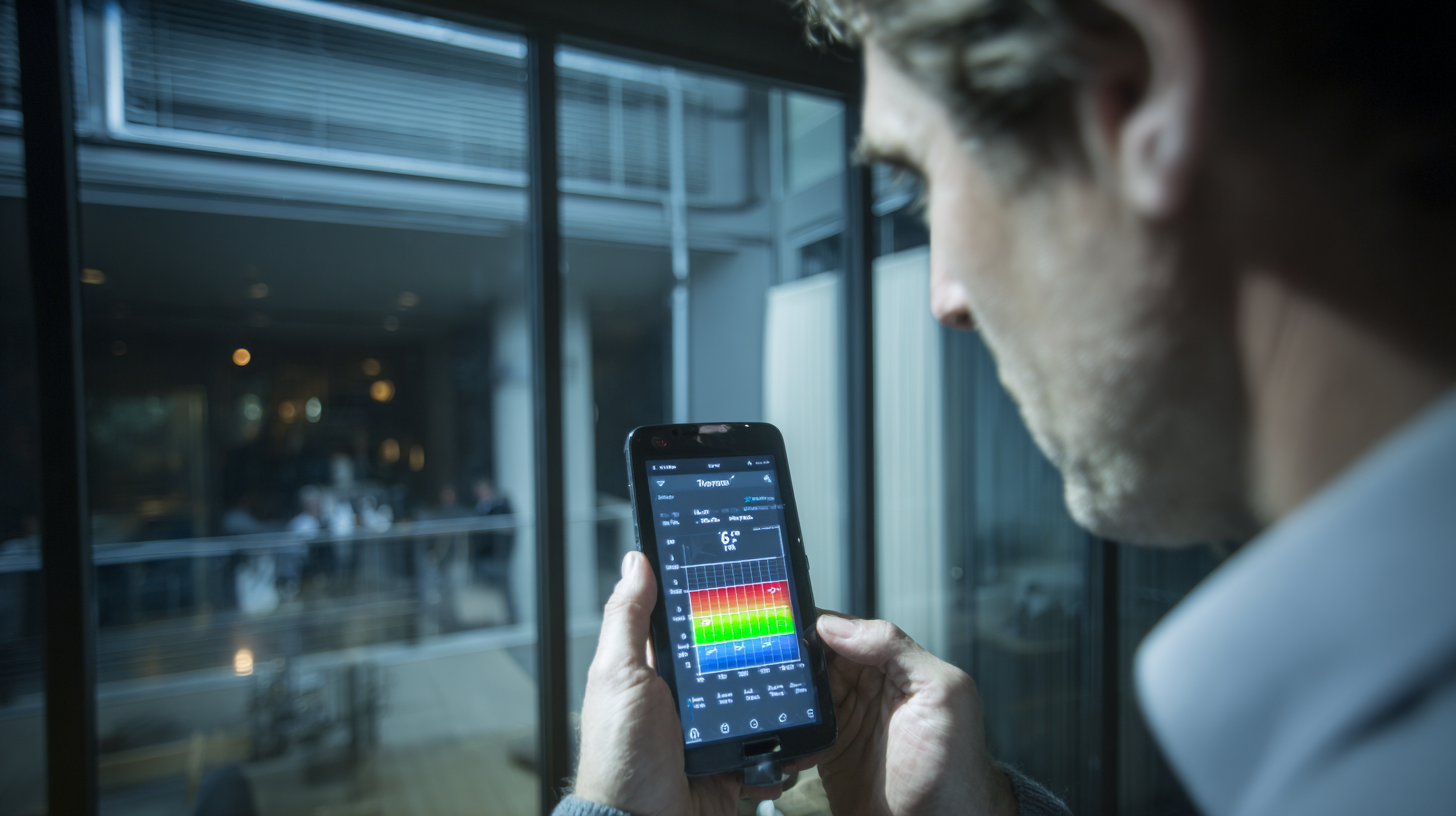
One crucial tool in achieving optimal indoor conditions is the Thermal Comfort Measuring System.
This system utilizes advanced sensors and algorithms to assess parameters like temperature,
humidity, air quality, and airflow,
providing real-time data to help stakeholders make informed decisions.
According to the ASHRAE Standard 55, maintaining a balanced thermal environment is essential for ensuring occupant satisfaction, while also adhering to health and safety regulations.
By leveraging a Thermal Comfort Measuring System, building managers can not only comply with these standards but also foster an environment that maximizes
comfort and efficiency for all occupants.
Understanding Thermal Comfort: Key Factors and Metrics for Measurement
Thermal comfort is a crucial aspect of indoor environment management, influencing occupant satisfaction, productivity, and overall well-being.
Understanding the key factors that contribute to thermal comfort involves examining variables such as air temperature, humidity, air velocity, and radiant temperature.
Air temperature, often the most emphasized metric, reflects the warmth or coolness of the air surrounding occupants.
Meanwhile, humidity affects the body’s ability to cool itself through perspiration, making it essential to maintain an optimal range for comfort.
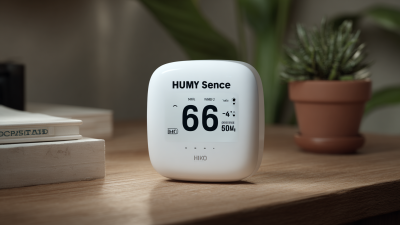
To effectively measure these factors, a thermal comfort measuring system can be employed.
Instruments like digital thermometers, hygrometers, and anemometers are used to gather data on temperature and humidity levels,
while specialized sensors can assess radiant heat.
By evaluating these metrics, building managers can identify areas of discomfort and make necessary adjustments, such as modifying HVAC settings or incorporating shading solutions.
Additionally, considering individual preferences and clothing insulation levels leads to a more personalized approach to achieving optimal thermal comfort in indoor spaces.
Selecting the Right Thermal Comfort Measuring System for Your Environment
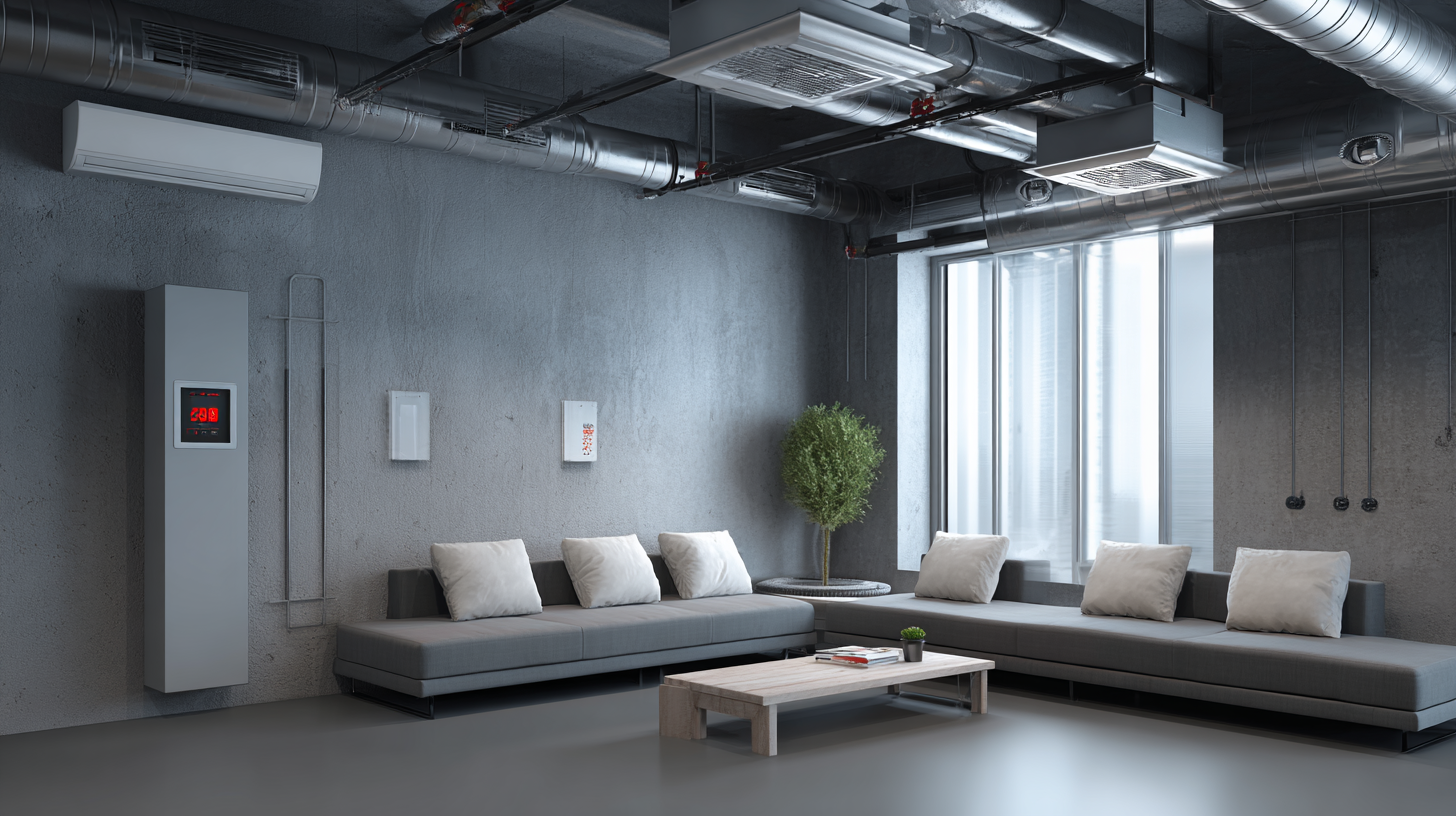
When selecting the right thermal comfort measuring system for your environment, it is crucial to consider the specific needs and characteristics of your space. Different environments, such as residential homes, offices, or industrial facilities, require tailored solutions. Look for systems that offer a comprehensive range of measurements, including temperature, humidity, and air quality, to ensure all factors contributing to thermal comfort are assessed.
**Tips:** When evaluating different systems, prioritize those that provide real-time data and user-friendly interfaces. Systems with mobile app connectivity can be particularly useful for monitoring conditions remotely and making timely adjustments. Additionally, consider the scalability of the system to accommodate future changes in your space or requirements.
Another factor to keep in mind is the installation and calibration process. Some systems may require professional setup, while others are designed for easy DIY installation. Choose a system that aligns with your technical capabilities and ensure proper calibration to achieve accurate readings. Regular maintenance and updates are essential to maintaining optimal performance, so select a solution that offers ongoing support and resources.
**Tips:** Research system reviews and user experiences before making a decision, as real-world feedback can provide valuable insights into reliability and effectiveness.
How to Utilize a Thermal Comfort Measuring System for Optimal Indoor Environments
| Measurement Parameter |
Optimal Range |
Recommended Devices |
Usage Tips |
| Air Temperature |
20-24°C |
Digital Thermometer, Infrared Thermometer |
Calibrate regularly, monitor in multiple areas. |
| Humidity |
30-60% |
Hygrometer, Smart Humidity Sensor |
Use dehumidifiers or humidifiers as needed. |
| Air Velocity |
0.1-0.3 m/s |
Anemometer, Thermal Anemometer |
Ensure even air distribution to avoid hotspots. |
| Mean Radiant Temperature |
18-22°C |
Radiant Temperature Measuring Device |
Pay attention to radiant heat sources. |
| Overall Thermal Comfort |
Acceptable Level (PMV between -0.5 to +0.5) |
Comfort Meter, Thermal Comfort Software |
Regular feedback from occupants can improve conditions. |
Data Analysis Techniques for Interpreting Thermal Comfort Measurements
To effectively utilize a thermal comfort measuring system, the interpretation of the collected data is crucial. Data analysis techniques play a significant role in identifying patterns and trends in thermal comfort measurements that can influence indoor environments. Reports from organizations such as ASHRAE indicate that a well-optimized indoor climate can enhance productivity by up to 20%. By employing statistical methods like regression analysis and machine learning algorithms, building managers can discern not only the current comfort levels but also predict future conditions based on historical data.
Furthermore, visualizing thermal comfort data through tools like heat maps can clarify spatial variations in temperature and humidity within a space. A recent study by the Lawrence Berkeley National Laboratory highlighted that optimizing thermal comfort through effective data interpretation could result in energy savings of approximately 30%. Such insights can lead to more informed decisions regarding HVAC system adjustments, ensuring that energy consumption is minimized while occupant satisfaction is maximized. By integrating these analytical techniques, stakeholders can create healthier, more efficient indoor environments, leveraging data to drive actionable improvements.
Implementing Strategies for Enhancing Indoor Thermal Comfort Based on Data
Achieving optimal indoor thermal comfort is crucial for enhancing the well-being and productivity of occupants. According to the World Health Organization, poor indoor temperature conditions can significantly impact health, with studies indicating that 20-30% of individuals experience discomfort within unsuitable environments. To address this, implementing a thermal comfort measuring system can provide valuable data that informs the design and management of indoor spaces.
Utilizing advanced sensors and analytics, organizations can collect real-time temperature data, humidity levels, and air quality metrics. A report by the American Society of Heating, Refrigerating and Air-Conditioning Engineers (ASHRAE) highlights that maintaining indoor temperatures between 68°F and 75°F can enhance comfort and efficiency in buildings. By regularly monitoring these parameters, facilities can adjust HVAC systems, ensuring that the indoor environment remains within this optimal range while minimizing energy consumption.
Moreover, incorporating feedback mechanisms, such as occupant surveys, can help fine-tune comfort strategies based on real user experiences. A survey by the Center for the Built Environment indicates that user satisfaction increases by 20% when occupants have a say in their thermal environment. By leveraging thermal comfort measuring systems and actively engaging building occupants, organizations can create spaces that not only meet industry standards but also promote overall well-being and productivity.
Evaluating User Feedback and System Performance for Continuous Improvement
User feedback plays a critical role in the effective utilization of thermal comfort measuring systems. By actively collecting and analyzing responses from occupants regarding their comfort levels, system operators can identify specific issues and preferences that may not be evident through data alone. This qualitative information provides valuable insights into how environmental factors—such as temperature, humidity, and air quality—affect user experience, allowing for tailored responses that enhance satisfaction.
Moreover, integrating feedback into system performance evaluation fosters continuous improvement. Regular assessments using metrics derived from both quantitative data and user input enable operators to refine their approaches. Implementing adjustments based on real-world experiences can lead to enhanced system calibration, optimizing indoor environments for better comfort and efficiency. By establishing a feedback loop between users and system technology, organizations can ensure their thermal comfort systems evolve in alignment with the needs and expectations of their occupants, ultimately creating a more conducive living or working atmosphere.
Thermal Comfort Metrics Evaluation
This bar chart illustrates the evaluation of thermal comfort metrics based on user feedback and system performance over a three-month period. The data reflects the average user satisfaction ratings on a scale of 1 to 10, concerning the indoor thermal environment. The goal is to highlight how feedback can be utilized to improve comfort levels continuously.
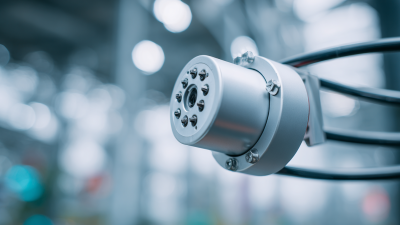
 Sensor
 Measuring Instruments
 Measurement Systems
 Architectural Physics Laboratory